
Charts and Candlesticks
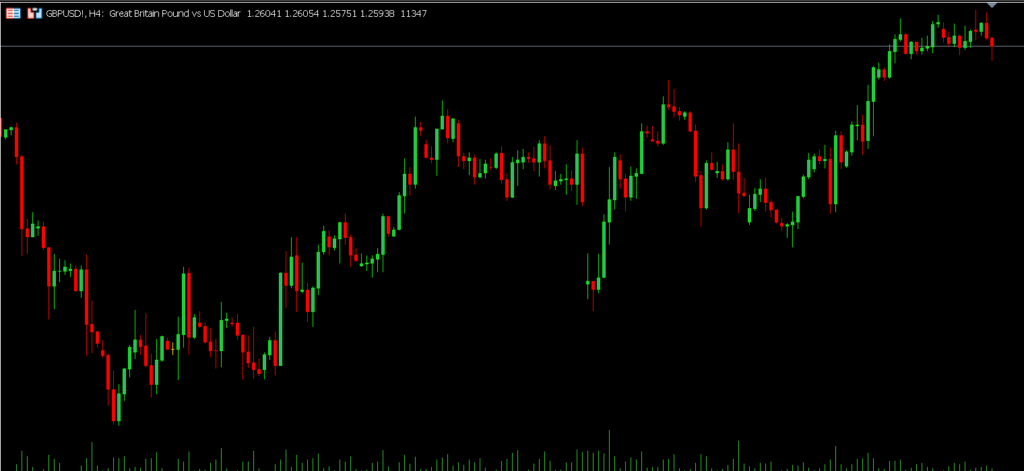
📊 Line Chart – Like drawing a simple treasure map! 📈 Bar Chart – A graph that looks like a city skyline! 🕯 Candlestick Chart – Each candle tells a story of price movement – some happy, some sad!
Indicators – Your Forex Superpowers!
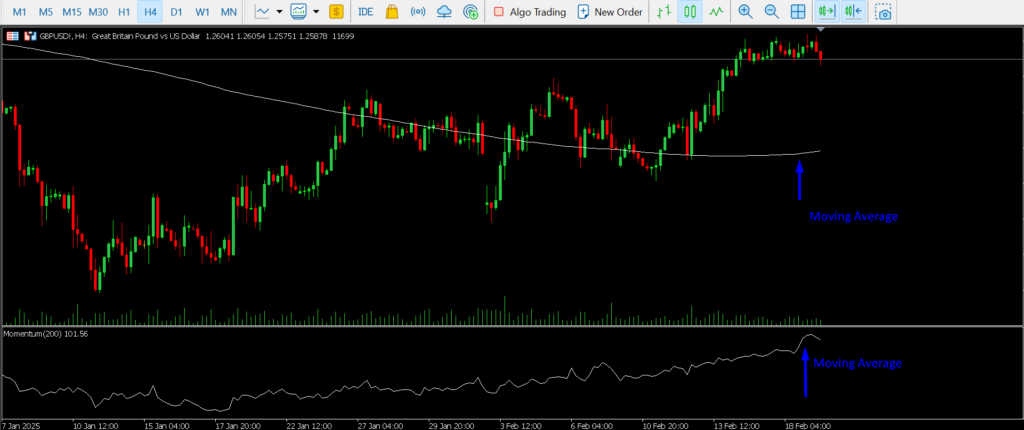
🦸♂️ Moving Averages – Spot trends like a superhero with x-ray vision! 🚦 RSI (Relative Strength Index) – Red light means stop, green light means go! 📡 MACD (Moving Average Convergence Divergence) – The radar that helps spot trends easily!
