
Forex trading relies heavily on charts to take any trade. Two types of analysis are done on charts to trade, one is indicators and the other is chart patterns. A chart pattern or price pattern is formed on any chart when the price of a currency etc. takes the form of a graph. Chart patterns play a very important role in technical analysis in stock and commodity market trading. Chart patterns are formed repeatedly. Chart patterns sometimes draw attention to market reversals and sometimes to its opposite.
Forex Chart Pattern Types
The following three chart patterns of technical analysis are used in Forex trading.
- Traditional chart patterns
- Harmonic chart patterns
- Candlestick chart patterns
Traders use chart patterns according to their needs.
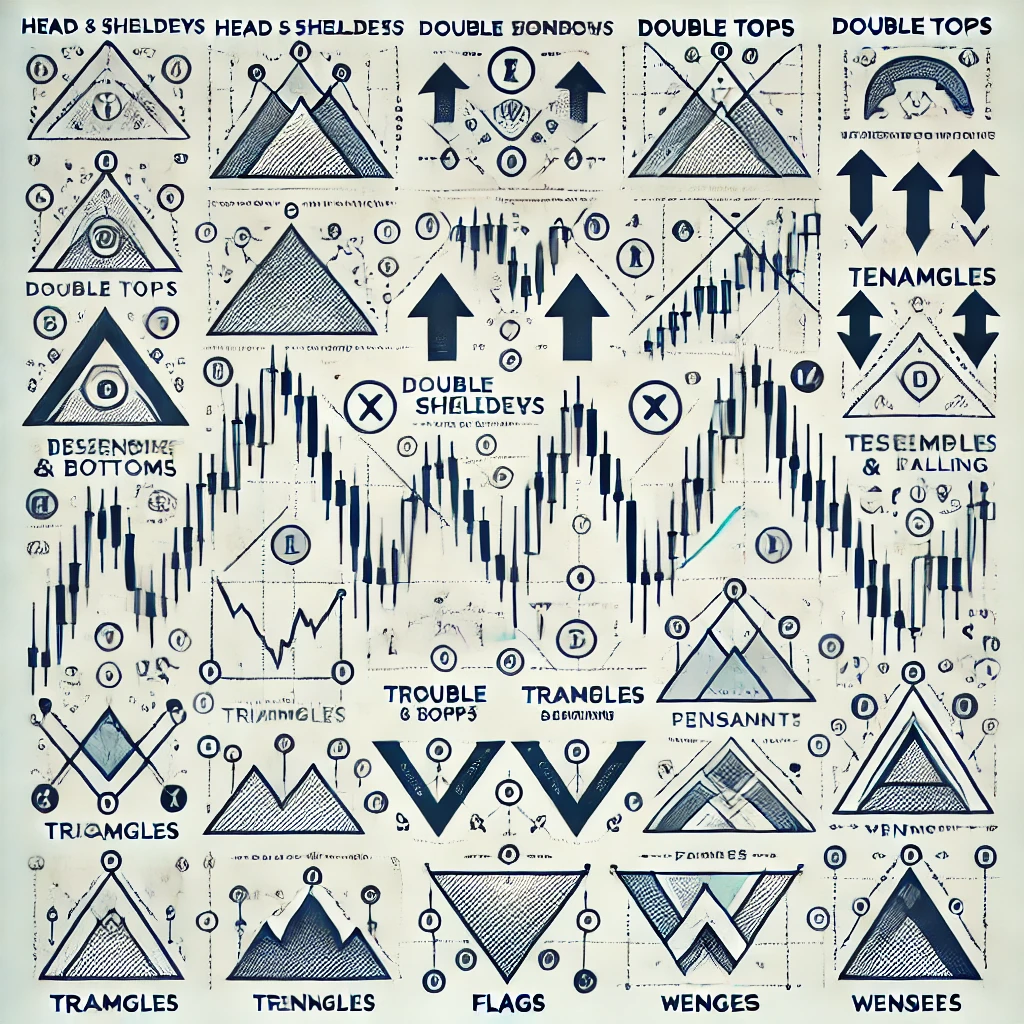
Traditional Chart Patterns
The following types of traditional chart patterns are commonly used and were introduced centuries ago.
1.Double Top – Double Bottom
2.Triple Top – Triple Bottom
3.Head and Shoulders
4.Triangle
5.Wedge
6.Flag and Pennant
7.Channel
Candlestick Chart Pattern
The following types of traditional chart patterns are commonly used and were introduced centuries ago.
1.Double Top – Double Bottom
2.Triple Top – Triple Bottom
3.Head and Shoulders
4.Triangle
5.Wedge
6.Flag and Pennant
7.Channel
